The 10 Most Deadly American Cities for Drivers

Heavy traffic, bad weather, and poorly designed highways. People speeding, texting, staring at their GPS, and straight-up not paying attention. When you think about it, your daily commute is probably the most dangerous thing you do every day. But how dangerous is it, exactly?
To find out, I dug through a mountain of data from the National Highway Traffic Safety Administration's Fatality Accident Reporting System to find the most deadly cities for drivers in the United States.
A quick note on the data: these 10 metropolitan areas are ranked by the number of fatal car accidents that occurred in 2013 -- not by the total number of deaths. We're looking at the potential danger to you, not total body counts. Since many areas have much larger suburban populations than their core cities (here's looking at you, Dallas and Phoenix), we've included the nearby cities and suburbs most commonly found in the statistical data.* The results were... well, don't drive to the suburbs of LA, okay?

10. Philadelphia
Fatal car accidents in metro area: 99
City-by-city breakdown: Philadelphia, 84; Camden, 6; Trenton, 6; Wilmington, 3
The City of Brotherly Love is actually not that bad, until you realize how centralized the accidents are in Philly proper.
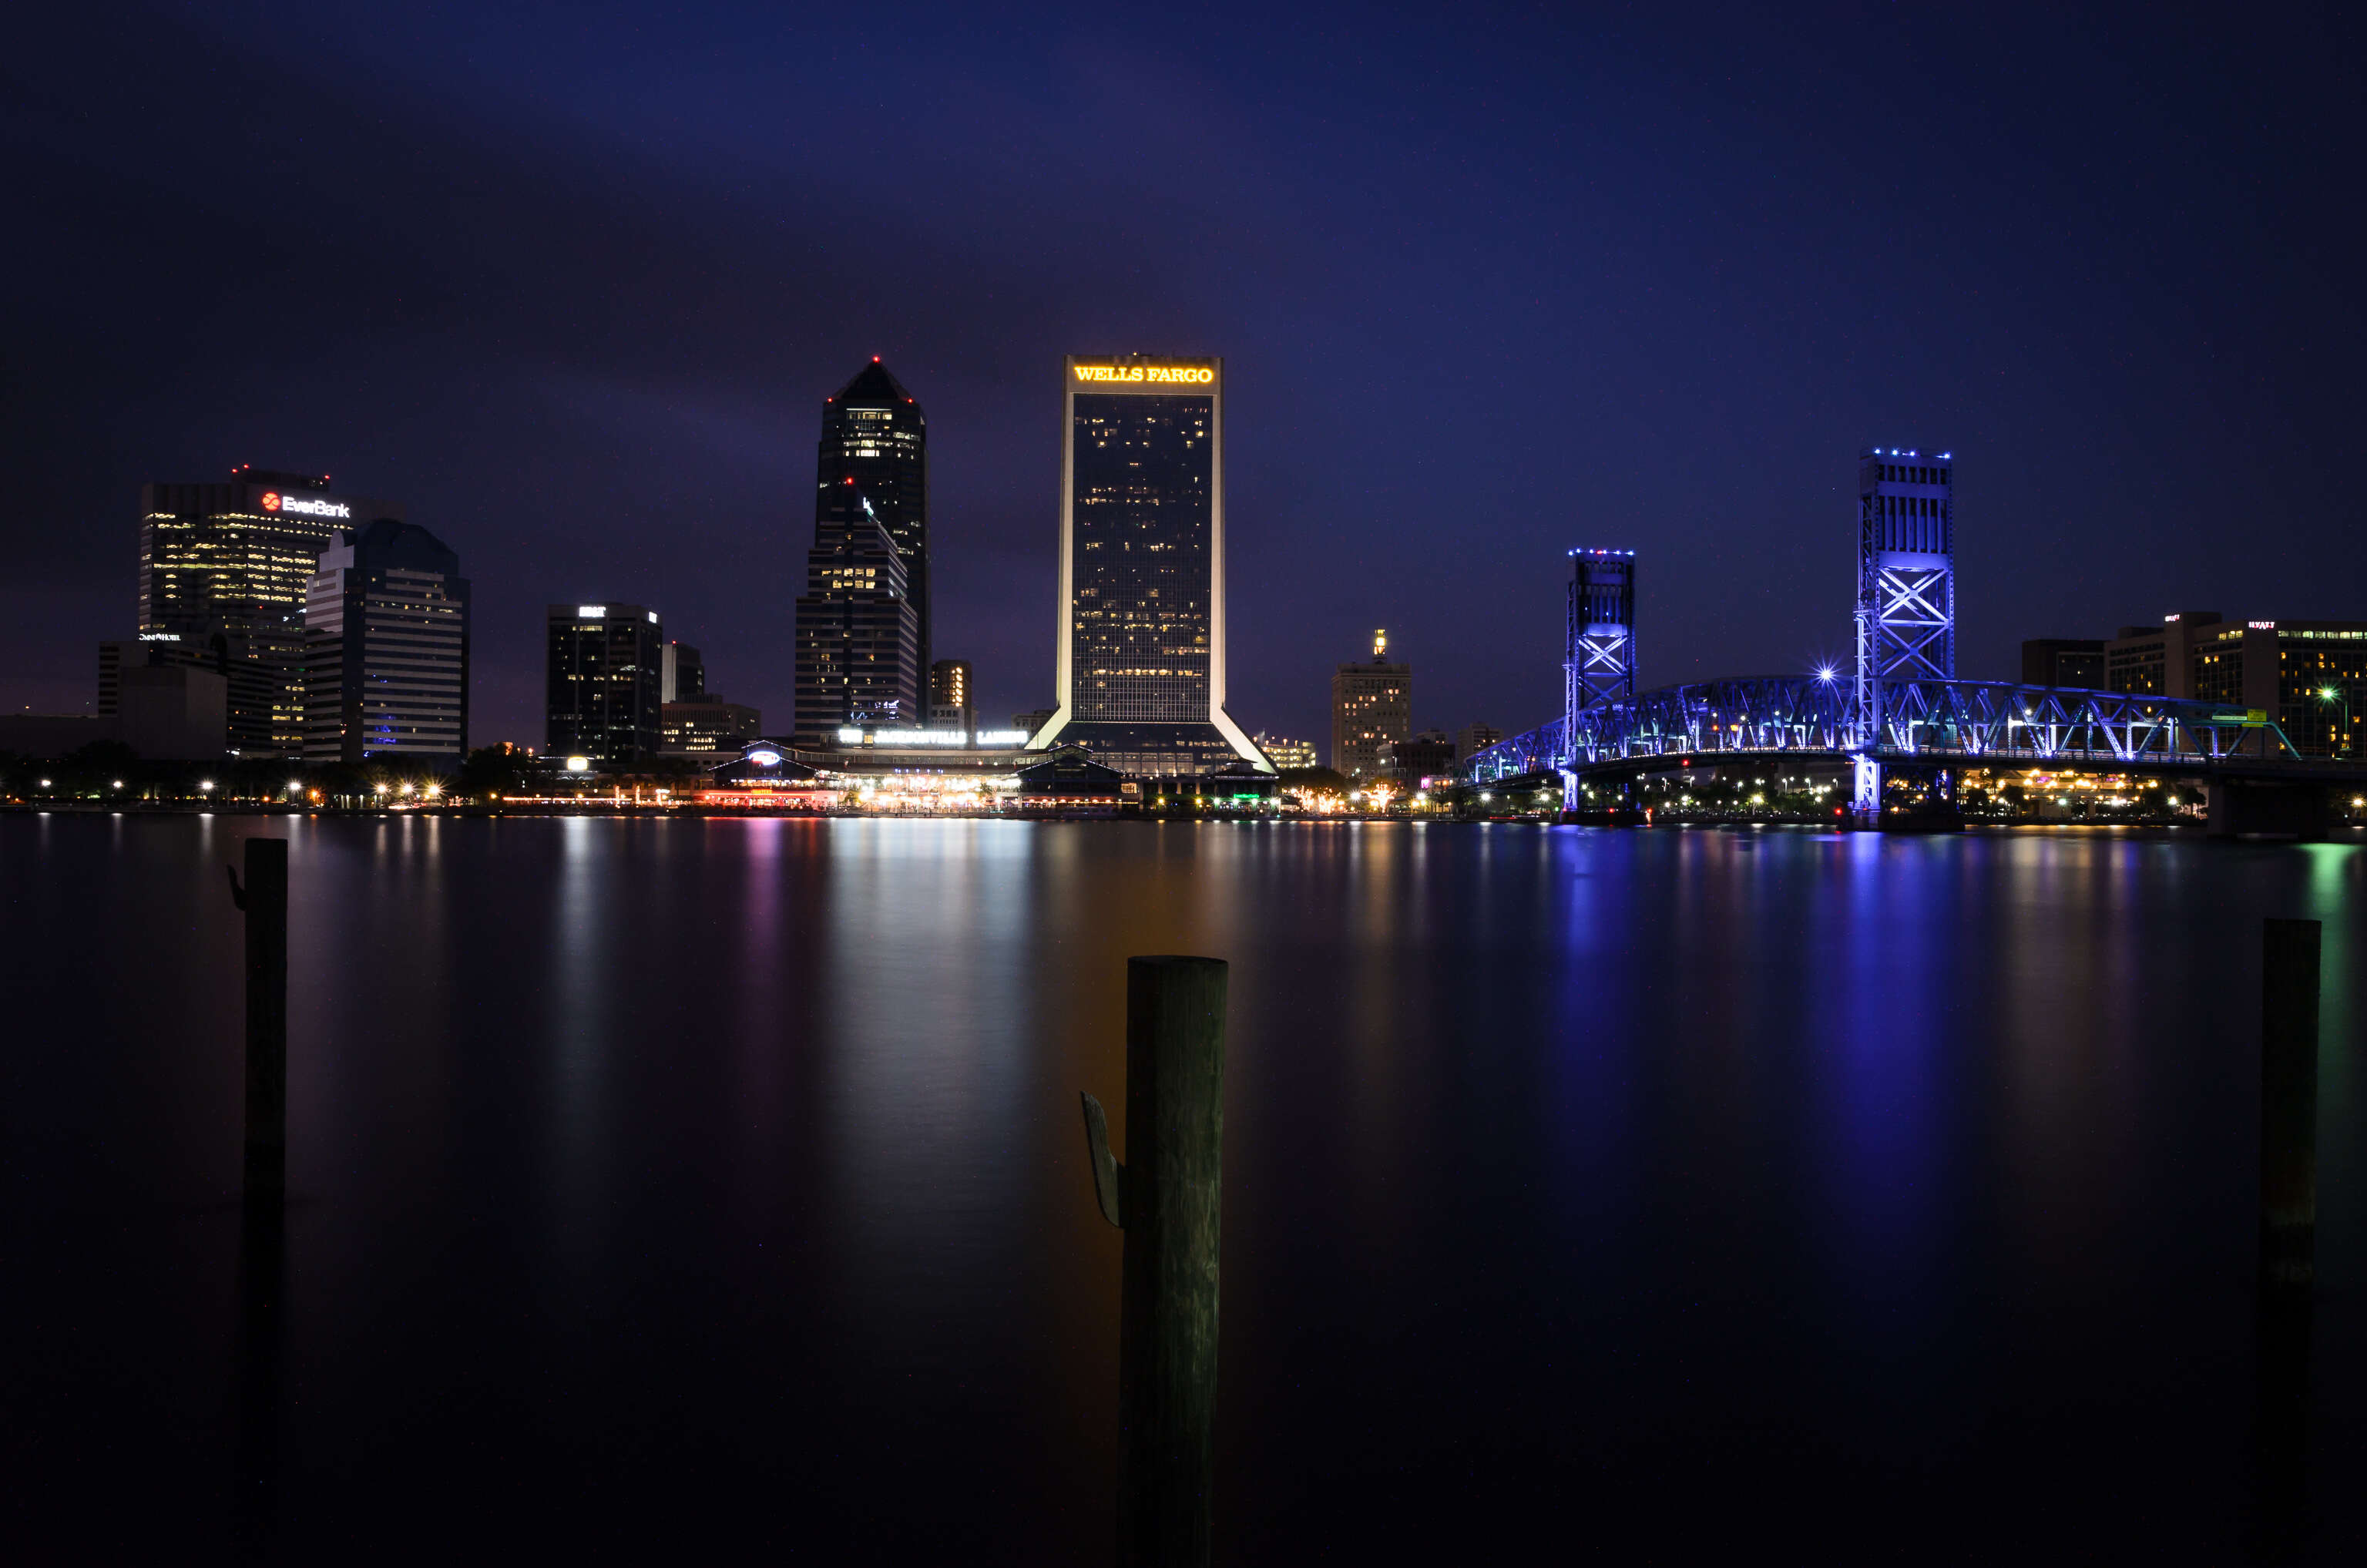
9. Jacksonville
Fatal car accidents in metro area: 126
City-by-city breakdown: Jacksonville, 119; St. Augustine, 5; Jacksonville Beach, 1; Macclenny, 1
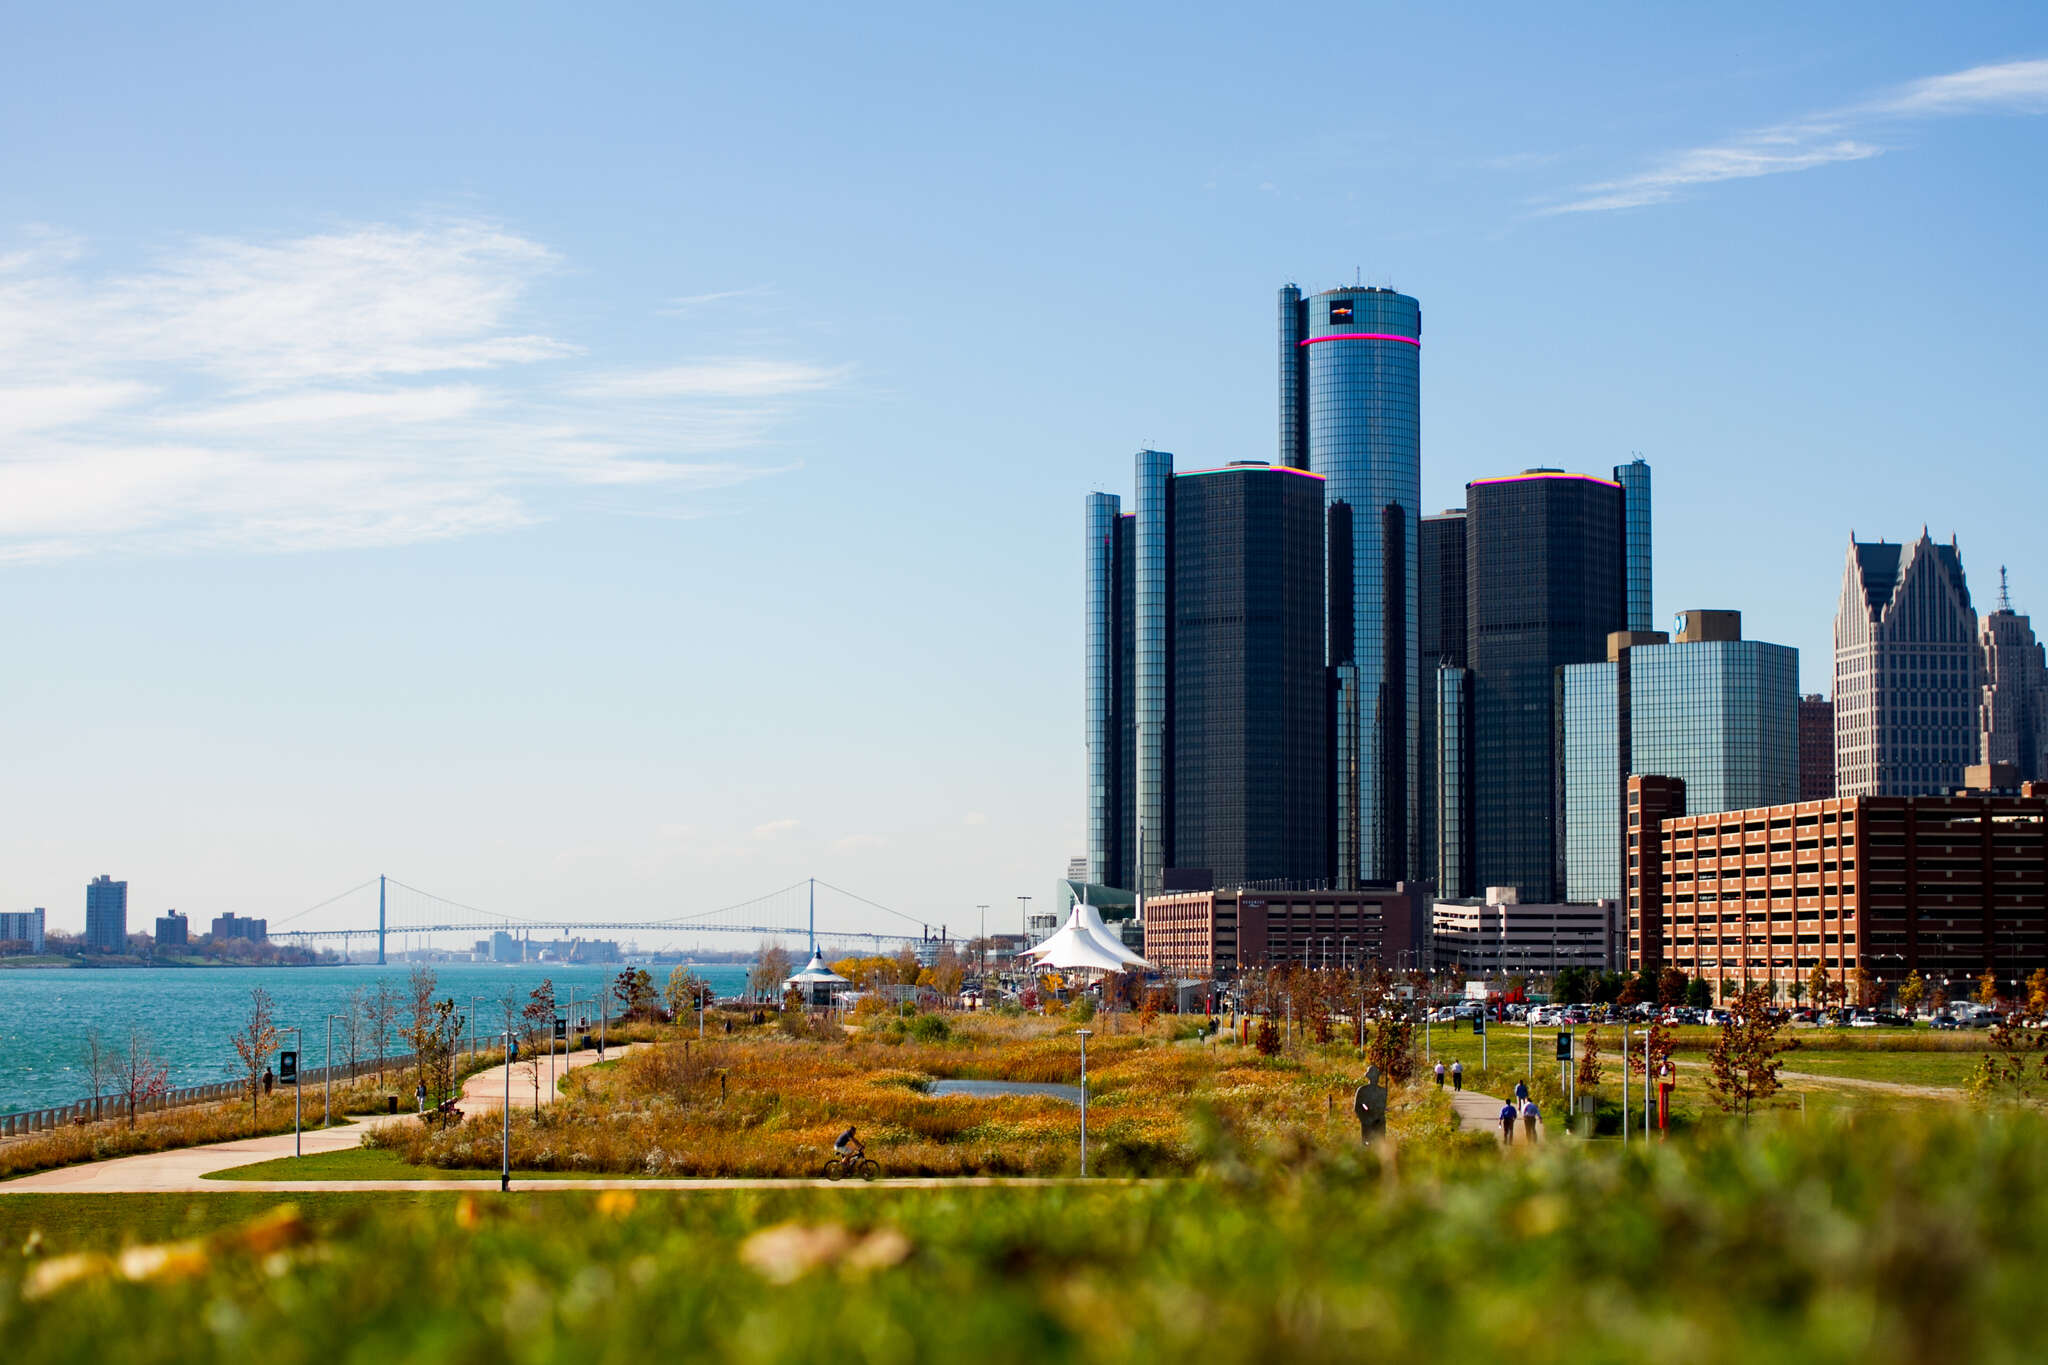
8. Detroit
Fatal car accidents in metro area: 140
City-by-city breakdown: Detroit, 105; Canton Township, 4; Clinton Township, 8; Dearborn, 8; Farmington Hills, 3; Livonia, 2; Sterling Heights, 4; Troy, 3; Warren, 1; Westland, 2
Detroit proper might seem like one of the less-populated cities on this list nowadays, but given the number of people commuting across multiple cities to get to work each day, this number kinda makes sense.
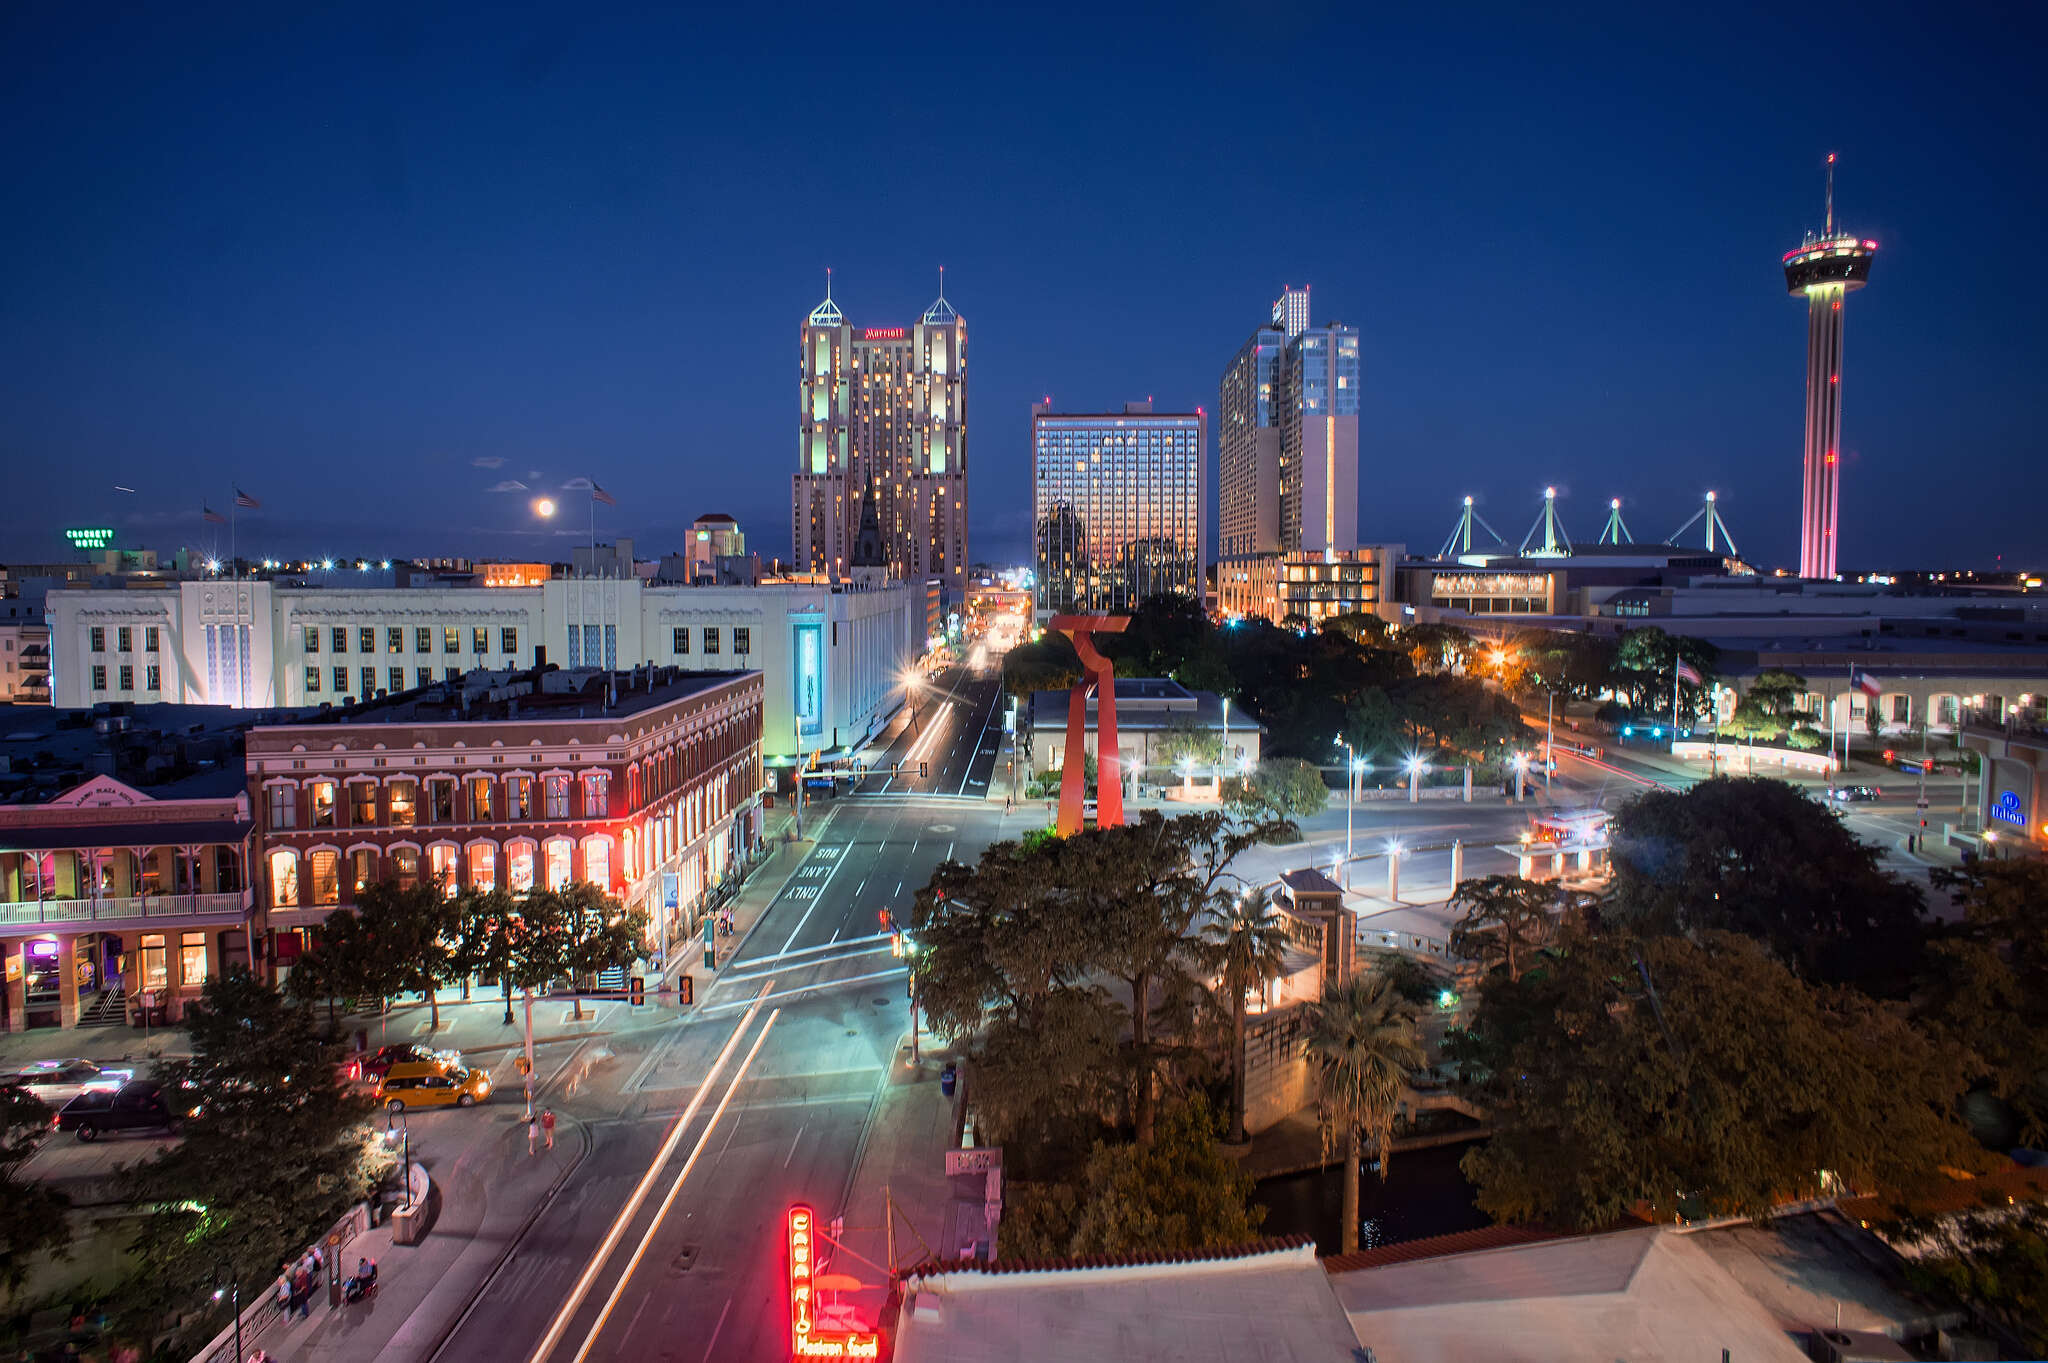
7. San Antonio
Fatal car accidents in metro area: 167
City-by-city breakdown: San Antonio, 153; New Braunfels, 7; Schertz, 3; Seguin, 4
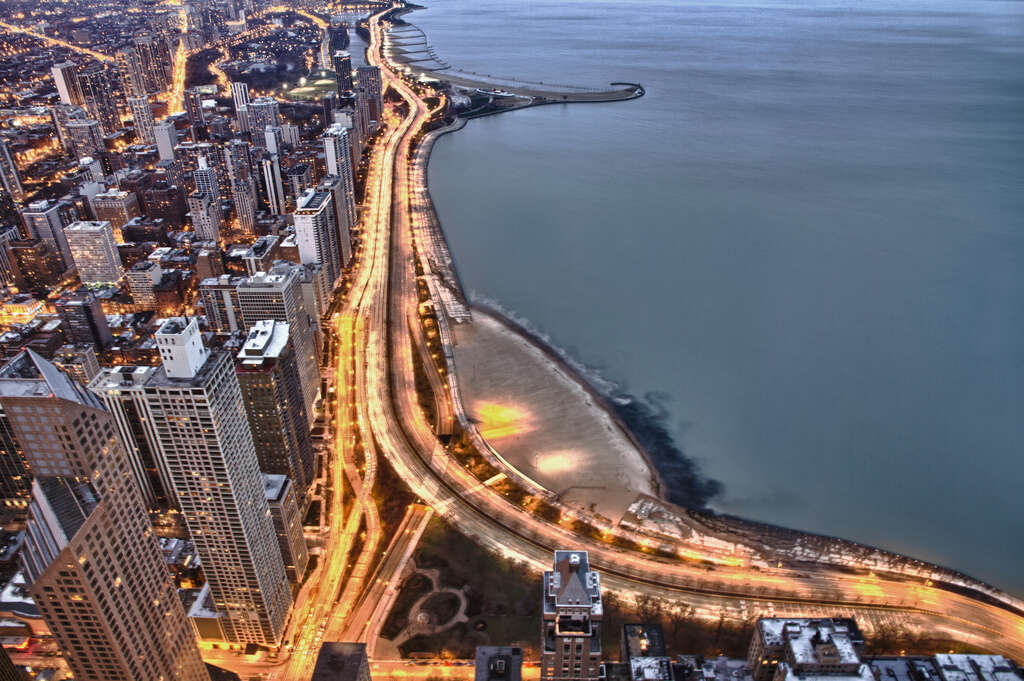
6. Chicago
Fatal car accidents in metro area: 174
City-by-city breakdown: Chicago, 121; Arlington Heights, 1; Aurora, 5; Berwyn, 2; Bolingbrook, 1; Cicero, 1; Des Plaines, 3; Elgin, 4; Elmhurst, 4; Gary, 6; Joliet, 4; Kenosha, 4; Naperville, 1; Oak Lawn, 3; Oak Park, 1; Orland Park, 1; Romeoville, 2; Palatine, 1; Skokie, 6; Waukegan, 4; Wheaton, 1
The fact that roughly 30% of fatal Chicagoland wrecks occur outside of Chicago city limits speaks to how vast a metropolitan area it really is.
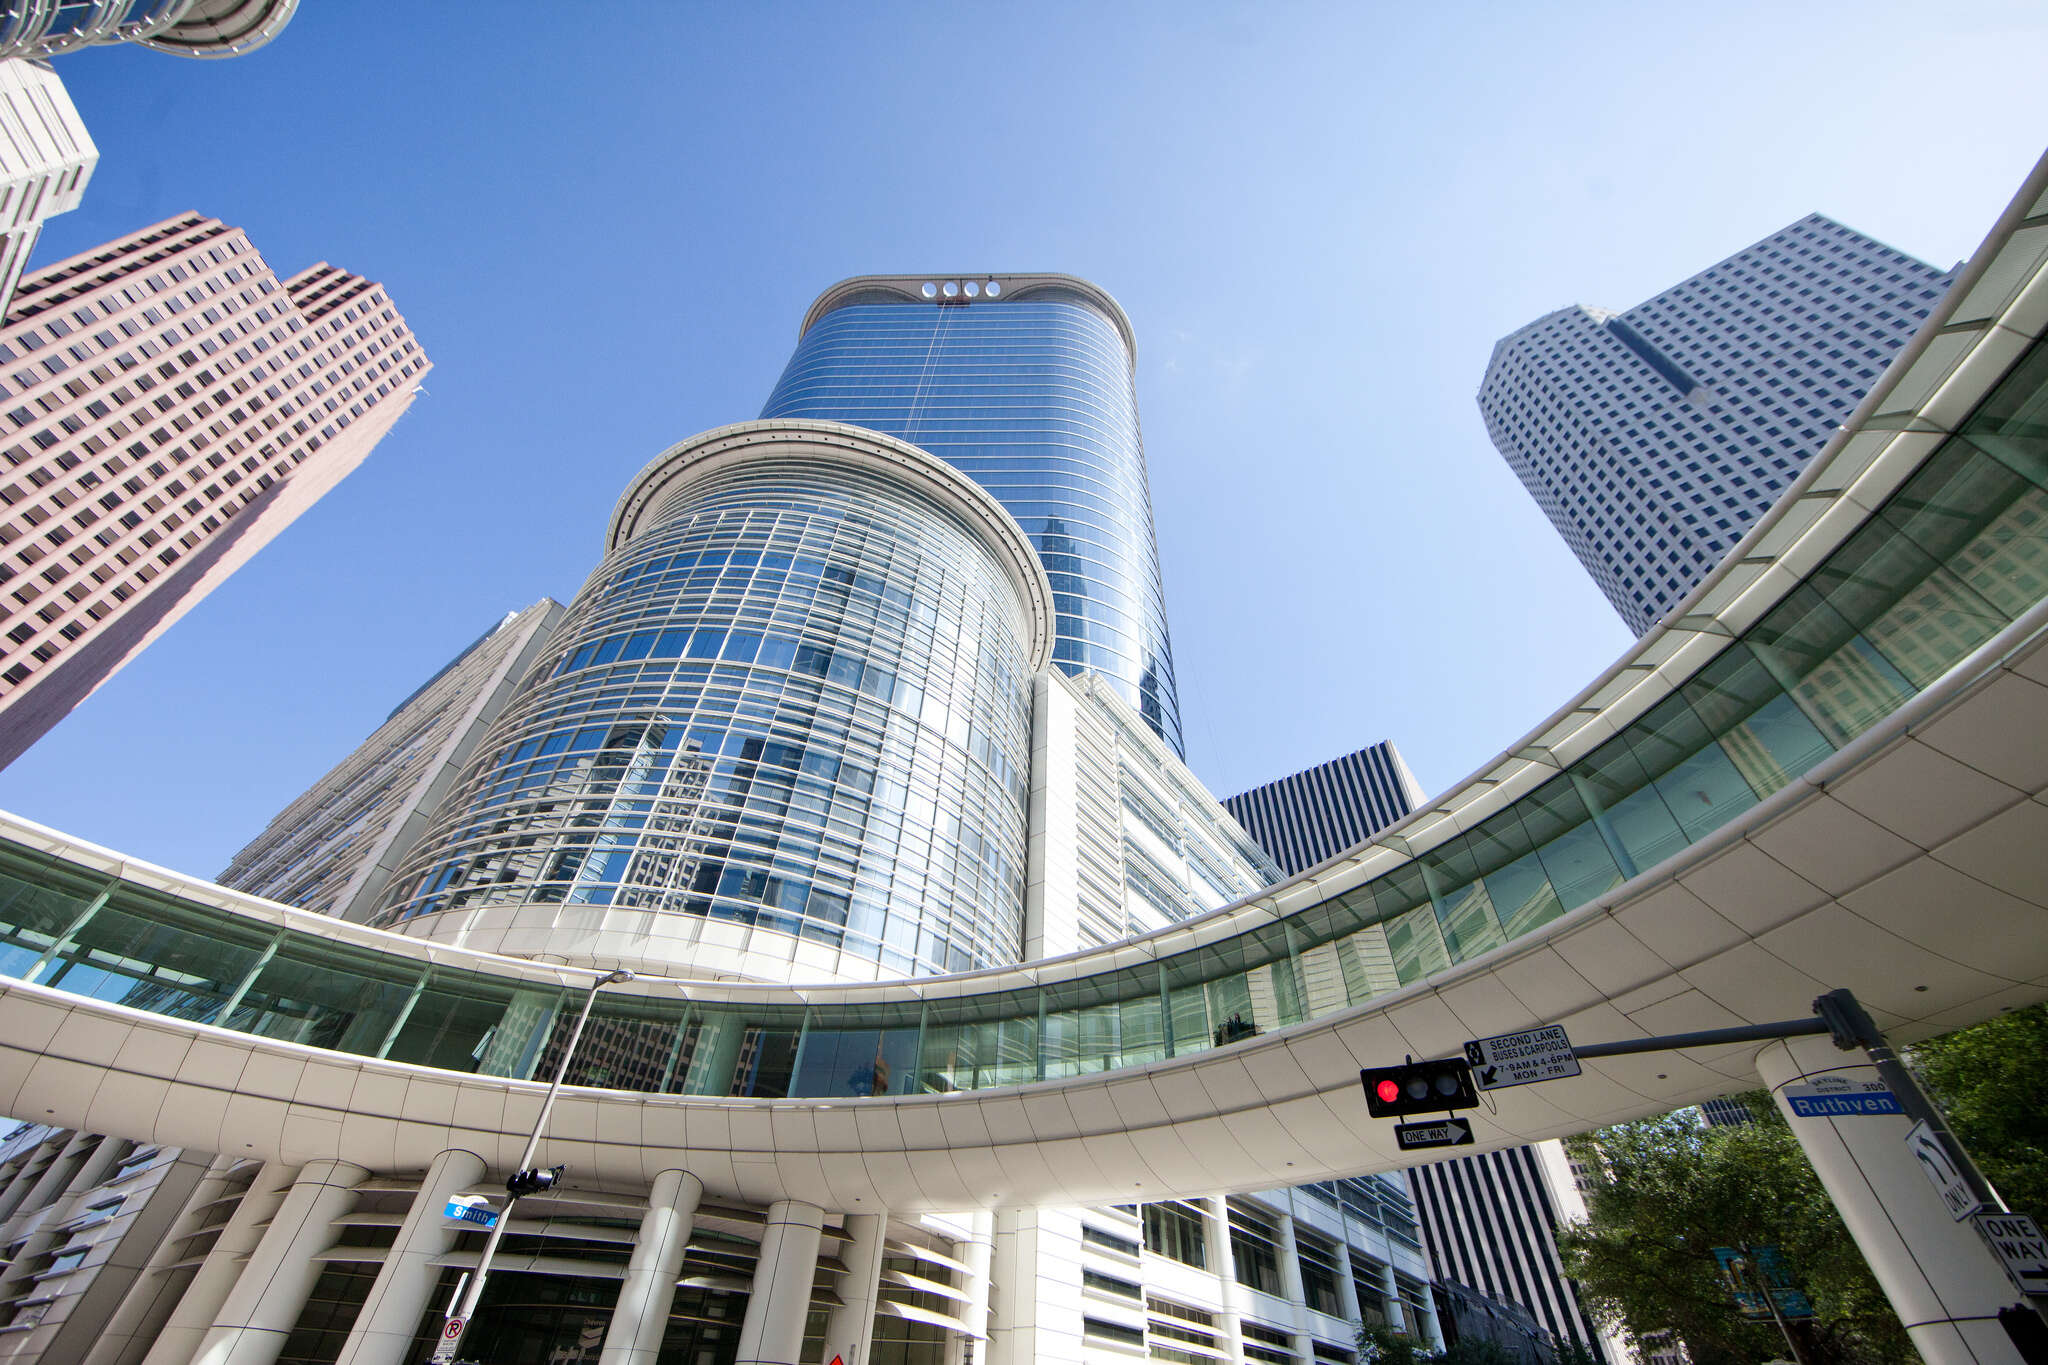
5. Houston
Fatal car accidents in metro area: 209
City-by-city breakdown: Houston, 182,; Baytown, 9; Conroe, 11; Sugar Land, 7
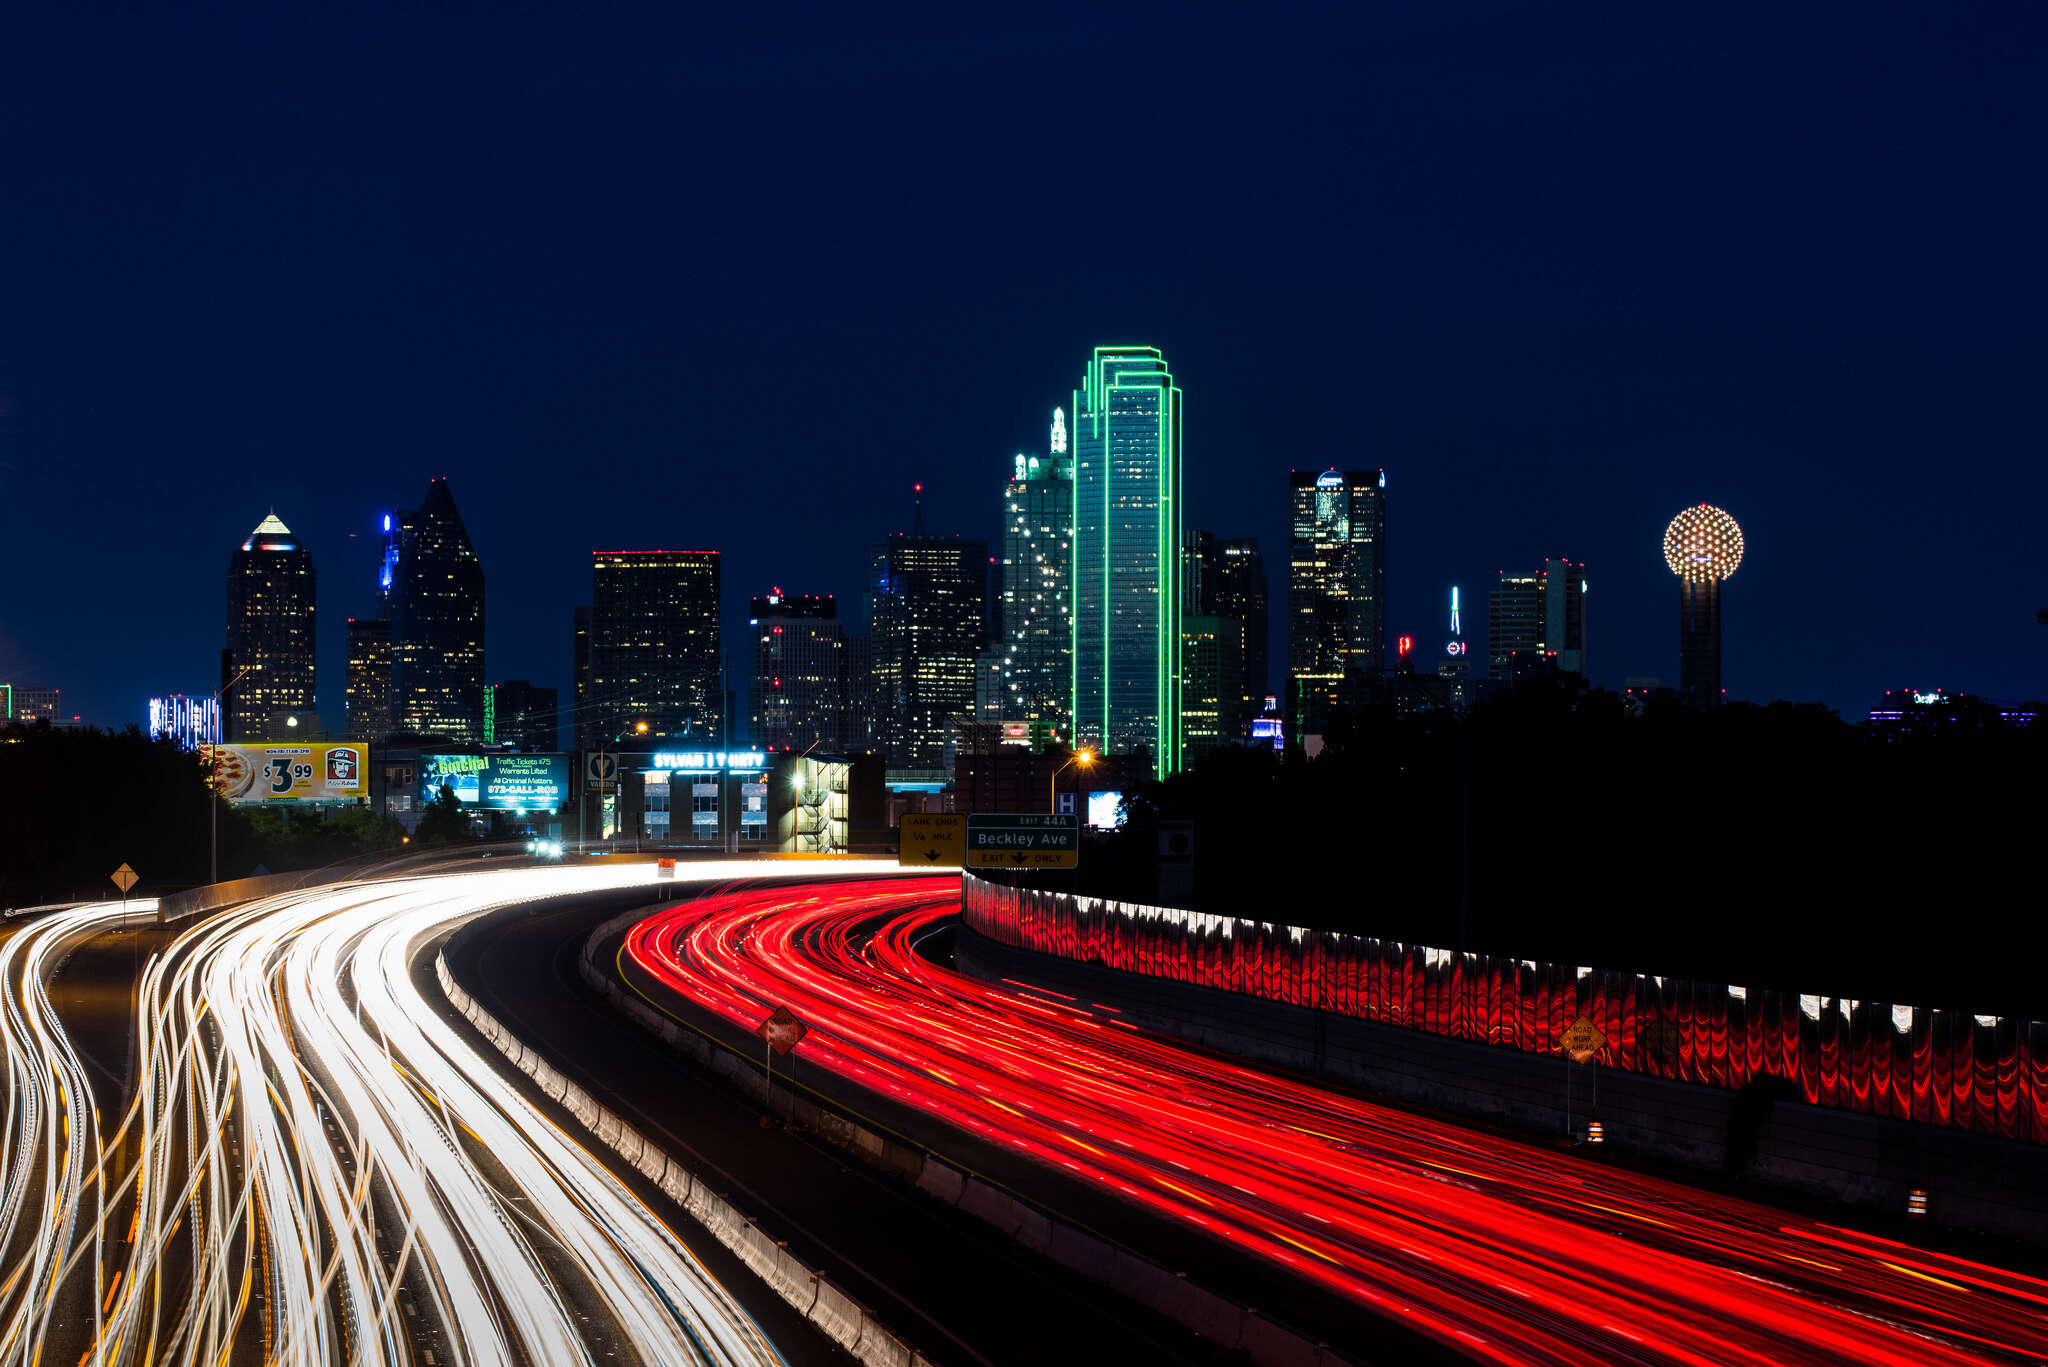
4. Dallas-Fort Worth
Fatal car accidents in metro area: 265
City-by-city breakdown: Dallas, 127; Fort Worth, 63; Arlington, 24; Carrollton, 8; Denton, 10; Frisco, 3; Grapevine, 4; Irving, 16; McKinney, 6; Plano, 9; Richardson, 3
For those keeping track at home, DFW is the third Texas city on this list. The one thing they've all got in common? They all came into their own during or after the rise of the automobile, and the public transit system in each is essentially a joke.

3. Phoenix
Fatal car accidents in metro area: 291
City-by-city breakdown: Phoenix, 167; Casa Grande, 7; Chandler, 12; Gilbert, 6; Glendale, 20; Maricopa, 2; Mesa, 36; Peoria, 5; Scottsdale, 11; Surprise, 5
Phoenix has a lot in common with Dallas and Houston as a sprawling and post-WWII booming metropolis. Interestingly, Mesa's data flies in the face of what you'd expect. Per NHTSA data, 65 is the age at which fatality accidents begin to climb, and Mesa has almost double the rate of elderly drivers (65+) than Phoenix proper. Still, Mesa's per-capita fatal accident rate is quite a bit lower than its larger neighbor.

2. Los Angeles
Fatal car accidents in metro area: 316
City-by-city breakdown: Los Angeles, 213; Anaheim, 17; Glendale, 8; Huntington Beach, 12; Irvine, 10; Long Beach, 27; Santa Ana, 24; Santa Clarita, 5
LA, as with the other suburb-heavy cities, sees a third of its fatal accidents outside of city limits, but really, when you consider the large population and the number of cars, 316 isn't as bad as some of the other cities on this list.

1. New York
Fatal car accidents in metro area: 344
City-by-city breakdown: Bronx, 50; Brooklyn, 84; Edison, 8; Jersey City, 4; Manhattan, 45; Mount Vernon, 3; New Rochelle, 3; Newark, 24; Paterson, 5; Queens, 91; Staten Island, 11; Union, 3; Woodbridge Township, 3; Yonkers, 7
While the per-capita accident rate seems, as with LA, kinda low for NY, it's very interesting that one of the least car-dependent cities in the US should have so many severe collisions. Makes us wonder how many of these were taxi related.
*The cities included mostly follow the Office of Management and Budget guidelines, though suburbs of significant size and relatively new growth were included, to account for the dated nature of the OMB's 2010 census data. Some large suburbs were not listed; this represents zero fatal accidents recorded by the NHTSA. The most recent NHTSA data is reflected here, which covers the 2013 calendar year.
Sign up here for our daily Thrillist email, and get your fix of the best in food/drink/fun.
Aaron Miller is the Rides editor for Supercompressor, and can be found on Twitter. He's somehow alive despite learning how to drive on the deadly streets of Dallas.