This Map Shows How Much Your State Spends on Rent
No one leaps for joy when reaching into their checkbooks to pay rent, which means the first of every month is universally loathed throughout the country. We know that urban hubs with some of the world’s foremost industries -- think tech in San Francisco, the entertainment industry in Los Angeles or finance in New York City -- are damn expensive, and rents demand a high proportion of people’s income.
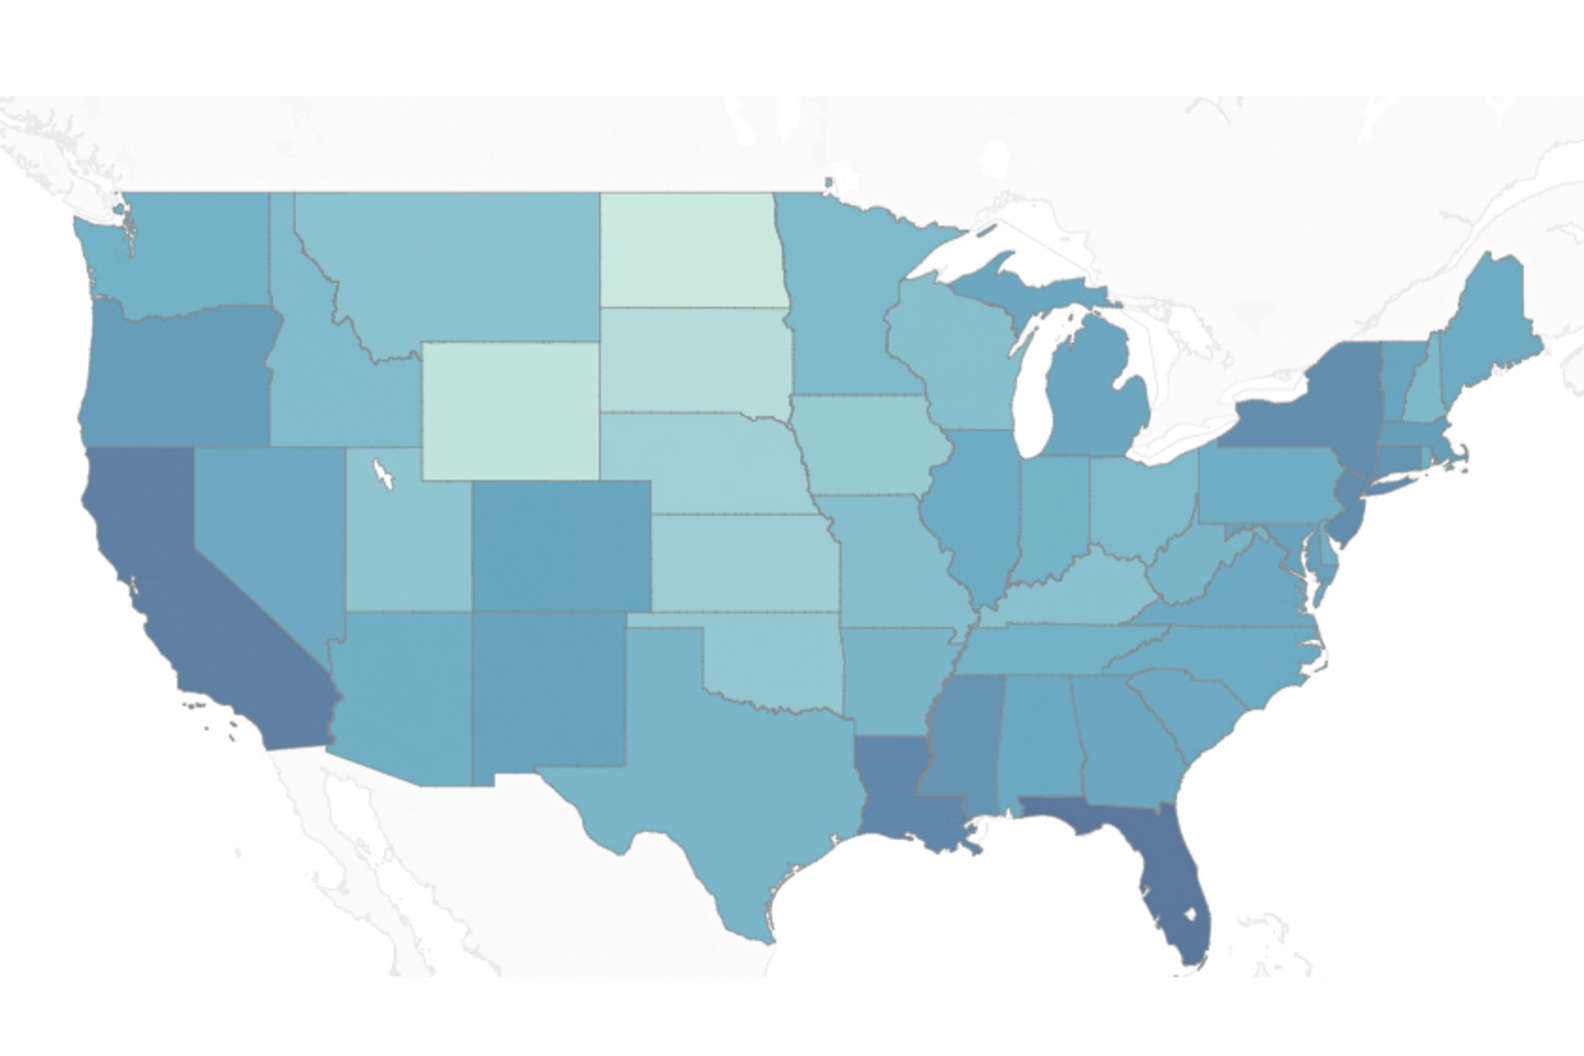
But how does the rest of the country stack up? Overflow Data, an independent data and research firm crunched the numbers using data compiled by the US Census Bureau in 2015, and found that the majority of Americans spend an average of 30.3% of their income on rent.
See for yourself:
Although many states fall into place exactly where one would expect, there are a few curveballs among the results, with Florida demanding the highest proportion of income to rent. (That shouldn’t really be a shocker though, as living in South Florida costs a pretty-penny: Miami was ranked the third most expensive city in the country in 2012, but made the mark at number 11 last year).
Renting in North Dakota will let your wallet breathe the most: As the least expensive state in the country, it’ll only demand 24.7% of your income.
Sign up here for our daily Thrillist email, and get your fix of the best in food/drink/fun.
Sam Blum is a News Staff Writer for Thrillist. He's also a martial arts and music nerd who appreciates a fine sandwich and cute dogs. Find his clips in The Guardian, Rolling Stone, The A.V. Club and Vice. He's on Twitter @Blumnessmonster.